Evaluation and Benchmarking#
Five lessons that treat decoding evaluation as a core skill, drawing on MOABB (Chevallier, Aristimunha et al. 2024) and the evaluation guidance in Cisotto and Chicco (2024). Difficulty 2-3; assumes the core workflow track and the leakage-safe split lesson in particular.
Evaluation is where most EEG decoding claims fall apart: the model trained on a single subject does not generalize to a held-out one, the single-split accuracy hides session drift, and a paired comparison between two pipelines is replaced by a bar chart with no statistics. This category builds, in order, from a single within-subject split toward a benchmark-grade paired comparison: which evaluation regime is honest for your claim, and how do you report it.
Evaluation Checklist#
Subject Disjointness. Always split by subject when testing generalization. Use
GroupKFold(groups=subjects).Fit Isolation. Keep all preprocessing and feature fit steps (e.g., CAR, ASR, Scaler) inside the training fold.
Chance Awareness. Report both accuracy and the majority-class chance level for your specific test set.
Statistical Rigor. Use paired subject-level statistics (e.g., Wilcoxon) when comparing pipelines.
Reproducibility. Save random seeds, dataset versions, and hardware specifications.
What you will learn:
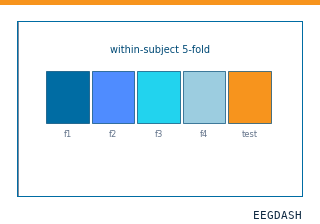
When within-subject diagnostics are appropriate, and when they are marketing.
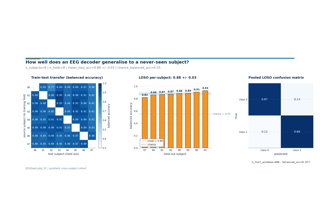
How to run a cross-subject evaluation – the gold standard for any generalization claim – with
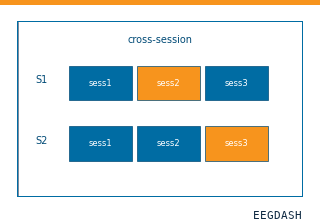
GroupKFoldand EEGDash’s split helpers.How to detect calibration drift across sessions of the same subject.
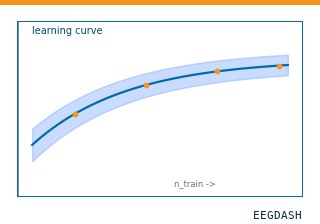
How to plot a learning curve as a function of training subjects, trials, or windows, and read it for sample-efficiency claims.
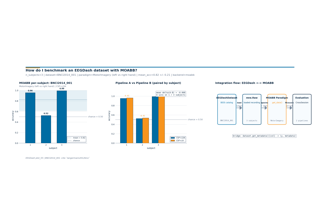
How to compare two pipelines on the same split and report the paired-Wilcoxon p-value the right way.
Run the lessons in order:
plot_50_within_subject_evaluation.py– single-subject diagnostics.plot_51_cross_subject_evaluation.py– the gold standard for generalization.plot_52_cross_session_evaluation.py– calibration drift across sessions.plot_53_learning_curves.py– performance vs training data size.plot_54_compare_two_pipelines.py– paired comparison with the Wilcoxon test.