


Note
Go to the end to download the full example code or to run this example in your browser via Binder.
Within-subject decoding on real trials#
Estimate prediction on held-out trials of each known participant. This diagnostic does not estimate performance on a new participant or session.
Data: Nakanishi2015, NEMAR nm000118, subjects 1–3, session 0,
run 0: approximately 21.1 MB on first download. Set EEGDASH_CACHE_DIR
to reuse the cache. This processed release already includes filtering,
downsampling and latency handling; do not add another latency correction.
See the source study
and NEMAR release.
Before running, work through tutorials 02 and 11: a window has a signal, an observed target, and a recording identity. Install EEGDash with its Braindecode and scikit-learn dependencies; this script needs no earlier output files. The result is one diagnostic score for each known person. Choose this protocol when calibration trials from that person are available.
1. Select a small, explicit cohort#
Filtering subjects, session and run bounds the download. Cropping after opening a recording would reduce computation but not its download size.
import os
from functools import partial
from pathlib import Path

import matplotlib.pyplot as plt
import numpy as np
import pandas as pd
from braindecode.preprocessing import create_windows_from_events
from sklearn.linear_model import LogisticRegression
from sklearn.metrics import balanced_accuracy_score
from sklearn.pipeline import make_pipeline
from sklearn.preprocessing import StandardScaler

from eegdash import EEGDashDataset
from eegdash.features import (
    FeatureExtractor,
    extract_features,
    spectral_bands_power,
    spectral_preprocessor,
)

cache_dir = Path(os.environ.get("EEGDASH_CACHE_DIR", ".eegdash_cache"))
subjects = ["1", "2", "3"]
dataset = EEGDashDataset(
    cache_dir=cache_dir,
    dataset="nm000118",
    subject=subjects,
    session="0",
    run="0",
    task="ssvep",
    n_jobs=1,
)
assert len(dataset.datasets) == len(subjects), "Expected one recording per subject"
print(dataset.description[["subject", "session", "run"]])
  subject session run
0       1       0   0
1       2       0   0
2       3       0   0
2. Inspect real annotations and verify the signal contract#
Accessing raw downloads that recording. Annotation names identify the
attended stimulus frequency in Hz; they supply every classification label.
All participants must have the same channel order and sampling frequency.
raw = dataset.datasets[0].raw
sfreq = raw.info["sfreq"]
channel_names = raw.ch_names
class_names = sorted(set(raw.annotations.description), key=float)
mapping = {name: index for index, name in enumerate(class_names)}
assert len(mapping) == 12, "Expected the twelve SSVEP stimulus frequencies"
for recording in dataset.datasets:
    recording_raw = recording.raw
    assert recording_raw.ch_names == channel_names
    assert recording_raw.info["sfreq"] == sfreq
    assert set(recording_raw.annotations.description) == set(mapping)
print(f"Channels: {channel_names}; sampling frequency: {sfreq} Hz")
print("Stimulus frequencies (Hz):", class_names)
Channels: ['PO7', 'PO3', 'POz', 'PO4', 'PO8', 'O1', 'Oz', 'O2']; sampling frequency: 256.0 Hz
Stimulus frequencies (Hz): ['9.25', '9.75', '10.25', '10.75', '11.25', '11.75', '12.25', '12.75', '13.25', '13.75', '14.25', '14.75']
3. Make one four-second window per annotated trial#
Each annotated interval is 4.15 seconds. Keep its first four seconds and
discard the remainder. Explicit size and stride avoid overlapping windows
or extending the epoch beyond the recorded event duration.
At 256 Hz, four seconds contain 1,024 samples. The resulting array has
axes (540 trials, 8 EEG channels, 1,024 samples), with volt-valued data.
The metadata has one row per array row. target is a class index, not a
frequency in Hz; mapping is the explicit conversion between them.
The source contains 15 trials of each of the 12 frequencies per person.
A missing class is a data-contract failure, not a reason to relabel trials.
window_size = int(4 * sfreq)
windows = create_windows_from_events(
    dataset,
    mapping=mapping,
    trial_start_offset_samples=0,
    trial_stop_offset_samples=0,
    window_size_samples=window_size,
    window_stride_samples=window_size,
    on_last_window="drop",
    preload=True,
)
metadata = windows.get_metadata()
assert (metadata.i_window_in_trial == 0).all(), "Expected one window per trial"
assert not metadata.duplicated(["subject", "session", "run", "i_start_in_trial"]).any()
y = metadata["target"].to_numpy(dtype=int)
groups = metadata["subject"].astype(str).to_numpy()
X = np.stack([window[0] for window in windows])
assert X.shape == (len(metadata), len(channel_names), window_size)
assert set(groups) == set(subjects)
assert np.isfinite(X).all()
print(pd.crosstab(groups, y, rownames=["subject"], colnames=["class"]))
class    0   1   2   3   4   5   6   7   8   9   10  11
subject
1        15  15  15  15  15  15  15  15  15  15  15  15
2        15  15  15  15  15  15  15  15  15  15  15  15
3        15  15  15  15  15  15  15  15  15  15  15  15
4. Extract spectral features from each window#
SSVEP responses contain energy at the stimulus frequency. Use log spectral power around each stimulus frequency, retaining all eight posterior channels. This per-window transform learns nothing from other trials or subjects. The scaler below, in contrast, must be fitted only on training subjects. EEGDash’s shared spectral preprocessor computes a Welch PSD with one four-second Hann segment and 0.25 Hz bins. Each narrow band is centered on a documented stimulus frequency; these centers define the task, not trial-specific predictors. Retaining eight channels gives 12 × 8 = 96 features. The already processed SSVEP release does not need another EEGPrep cleaning pass or visual latency correction.
spectral_bands_power sums selected PSD bins. Multiplying by their 0.25 Hz spacing converts V²/Hz to approximate band power in V². The log compresses that scale; the StandardScaler still fits only on training participants.
bands = {
    f"hz_{name}": (float(name) - 0.125, float(name) + 0.125) for name in class_names
}
spectral = FeatureExtractor(
    {"power": partial(spectral_bands_power, bands=bands)},
    preprocessor=partial(
        spectral_preprocessor,
        fs=sfreq,
        nperseg=window_size,
        noverlap=0,
        f_min=8,
        f_max=16,
    ),
)
feature_table = extract_features(
    windows, {"spectral": spectral}, batch_size=64, n_jobs=1
).to_dataframe()
assert feature_table.shape == (len(y), len(class_names) * len(channel_names))
features = np.log(np.maximum(feature_table.to_numpy() * sfreq / window_size, 1e-30))
assert np.isfinite(features).all()
Extracting features:   0%|          | 0/3 [00:00<?, ?it/s]
Extracting features: 100%|██████████| 3/3 [00:00<00:00, 23.36it/s]
Extracting features: 100%|██████████| 3/3 [00:00<00:00, 23.31it/s]
5. Hold out complete trials within each participant#
Exactly one window represents each trial, so splitting window indices here also splits trials. With overlapping windows, group by original trial instead. This release concatenates trials; a random split makes no chronological claim.
from sklearn.model_selection import train_test_split
The 25% test fraction leaves 135 training and 45 test trials per subject. Stratification preserves representation of all twelve classes; with 15 trials per class, exact class proportions cannot always be retained after integer rounding. The fixed seed fixes assignments so code changes can be compared without silently changing the held-out trials.
StandardScaler estimates each feature’s mean and spread using training trials. LogisticRegression then fits its default L2-regularized classifier; max_iter=1000 is an optimization limit, not a hyperparameter search. If convergence warnings occur, inspect feature scales and solver convergence before interpreting the score.
rows = []
for subject in subjects:
    indices = np.flatnonzero(groups == subject)
    train, test = train_test_split(
        indices, test_size=0.25, random_state=42, stratify=y[indices]
    )
    assert set(train).isdisjoint(test)
    assert set(y[train]) == set(y[test]) == set(mapping.values())
    model = make_pipeline(StandardScaler(), LogisticRegression(max_iter=1000))
    model.fit(features[train], y[train])
    prediction = model.predict(features[test])
    rows.append(
        dict(
            subject=subject,
            balanced_accuracy=balanced_accuracy_score(y[test], prediction),
            n_test=len(test),
        )
    )
results = pd.DataFrame(rows)
print(results.to_string(index=False))
subject  balanced_accuracy  n_test
      1           0.381944      45
      2           0.263889      45
      3           0.666667      45
6. Plot actual held-out performance#
results.plot.bar(x="subject", y="balanced_accuracy", legend=False)
plt.axhline(1 / len(mapping), color="black", linestyle="--", label="Chance (1/12)")
plt.ylabel("Held-out trial balanced accuracy")
plt.ylim(0, 1)
plt.legend()
plt.show()
7. Interpret the diagnostic and choose the next split#
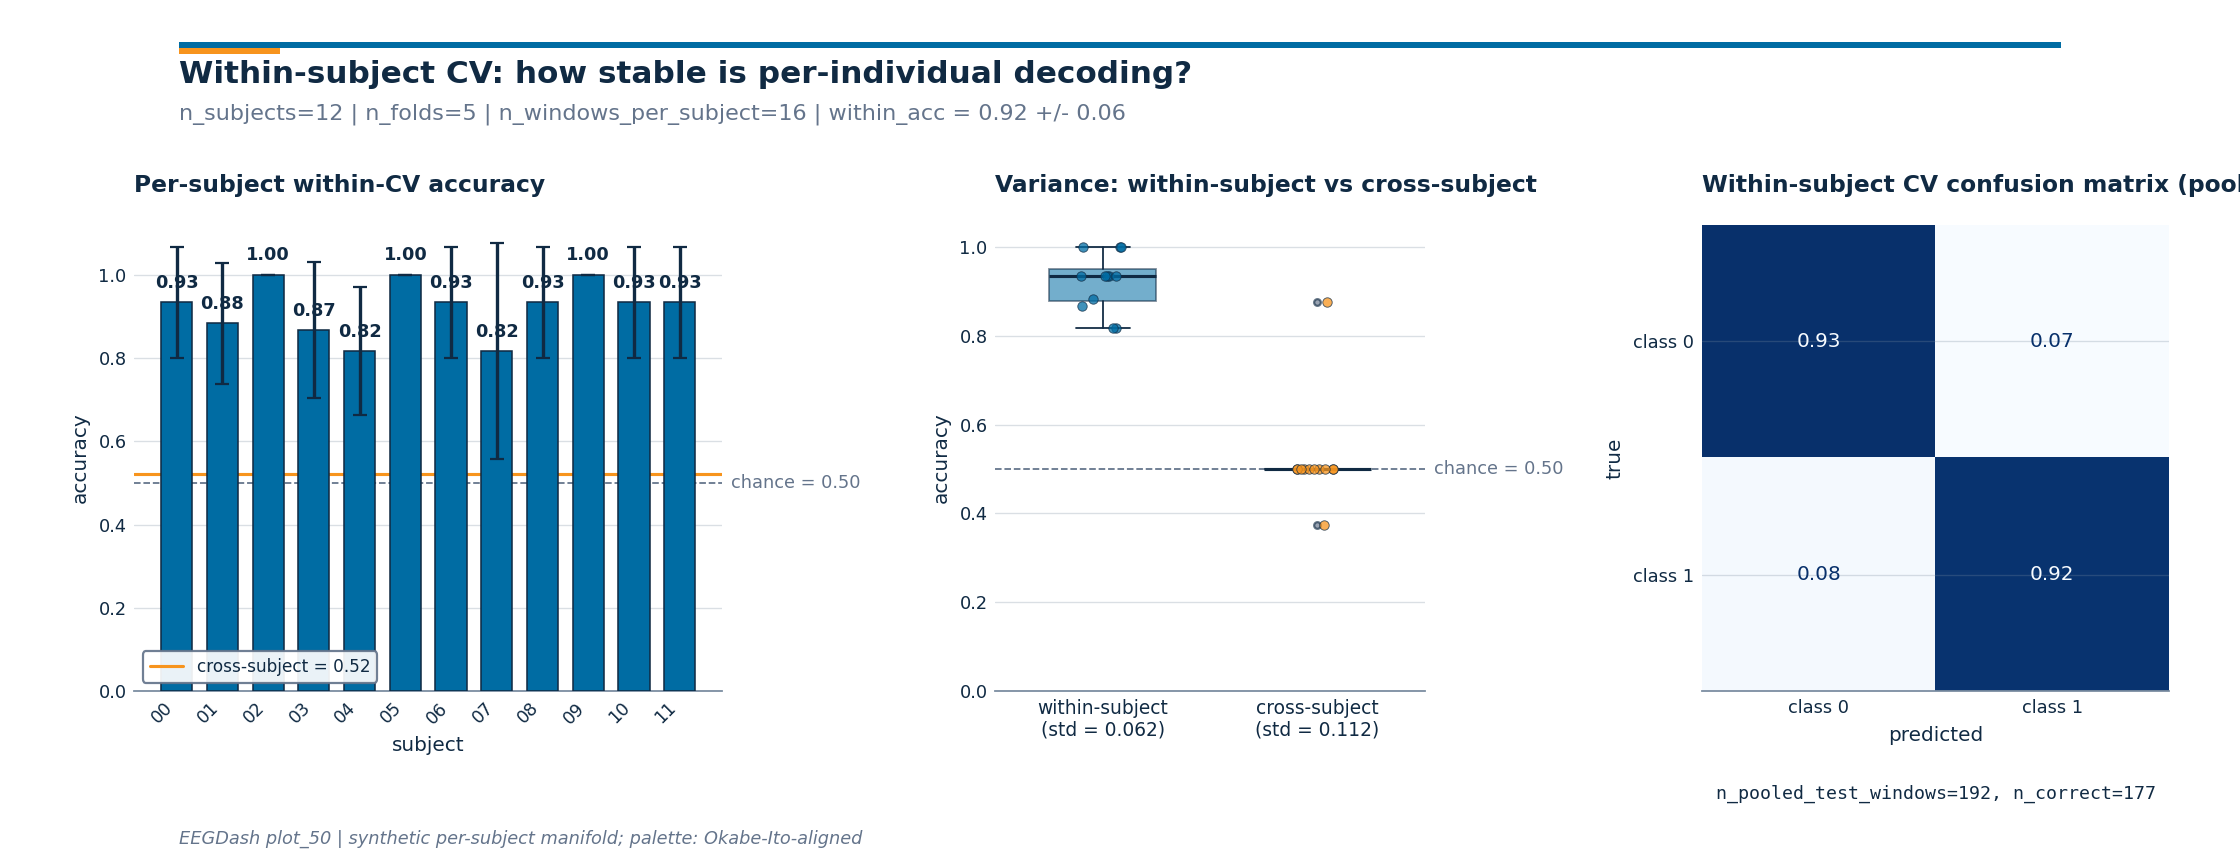
Balanced accuracy averages recall across stimulus frequencies, so every frequency contributes equally even when the held-out counts differ. The chance line is 1/12 for a uniform twelve-class prediction rule. A bar above that line is not a statistical significance test, and each bar depends on one random split with only 45 test trials.
For a calibration-size experiment, keep these test indices fixed and reduce only the training trials using class-stratified subsets. To answer whether the decoder works on an unseen person, use tutorial 51 instead; a within- subject score cannot answer that deployment question.
Total running time of the script: (0 minutes 1.072 seconds)
