


Note
Go to the end to download the full example code or to run this example in your browser via Binder.
Cross-subject decoding on real SSVEP recordings#
Can a decoder identify the flickering stimulus a new participant attended to?
We load three participants from the Nakanishi2015 SSVEP dataset through
eegdash.EEGDashDataset, extract event-labelled windows with
Braindecode, and evaluate a spectral baseline using leave-one-subject-out
cross-validation (LOSO).
Data: nm000118, subjects 1, 2, 3, session 0, run 0.
The three signal files total 21.1 MB, plus small BIDS sidecars. Internet is
required for the first download; set EEGDASH_CACHE_DIR to reuse it in CI.
CPU is sufficient. Install EEGDash and its dependencies before running.
These are real recorded signals distributed as a processed BIDS dataset, not the original unprocessed acquisition. See the NEMAR dataset and source study. The release already includes filtering, downsampling and latency handling; we use its event onsets without adding another latency correction.
Prerequisites are event-labelled windows (tutorial 02) and group splitting (tutorial 11). This script reloads its own data, so no feature CSV or trained checkpoint is required. We keep the feature definition and regularization fixed before LOSO; using these three test folds to choose a better setting would turn the reported test scores into model-selection scores.
1. Select a small, explicit cohort#
Filtering subjects, session and run bounds the download. Cropping after opening a recording would reduce computation but not its download size.
import os
from functools import partial
from pathlib import Path

import matplotlib.pyplot as plt
import numpy as np
import pandas as pd
from braindecode.preprocessing import create_windows_from_events
from sklearn.linear_model import LogisticRegression
from sklearn.metrics import ConfusionMatrixDisplay, balanced_accuracy_score
from sklearn.model_selection import LeaveOneGroupOut
from sklearn.pipeline import make_pipeline
from sklearn.preprocessing import StandardScaler

from eegdash import EEGDashDataset
from eegdash.features import (
    FeatureExtractor,
    extract_features,
    spectral_bands_power,
    spectral_preprocessor,
)

cache_dir = Path(os.environ.get("EEGDASH_CACHE_DIR", ".eegdash_cache"))
subjects = ["1", "2", "3"]
dataset = EEGDashDataset(
    cache_dir=cache_dir,
    dataset="nm000118",
    subject=subjects,
    session="0",
    run="0",
    task="ssvep",
    n_jobs=1,
)
assert len(dataset.datasets) == len(subjects), "Expected one recording per subject"
print(dataset.description[["subject", "session", "run"]])
  subject session run
0       1       0   0
1       2       0   0
2       3       0   0
2. Inspect real annotations and verify the signal contract#
Accessing raw downloads that recording. Annotation names identify the
attended stimulus frequency in Hz; they supply every classification label.
All participants must have the same channel order and sampling frequency.
raw = dataset.datasets[0].raw
sfreq = raw.info["sfreq"]
channel_names = raw.ch_names
class_names = sorted(set(raw.annotations.description), key=float)
mapping = {name: index for index, name in enumerate(class_names)}
assert len(mapping) == 12, "Expected the twelve SSVEP stimulus frequencies"
for recording in dataset.datasets:
    recording_raw = recording.raw
    assert recording_raw.ch_names == channel_names
    assert recording_raw.info["sfreq"] == sfreq
    assert set(recording_raw.annotations.description) == set(mapping)
print(f"Channels: {channel_names}; sampling frequency: {sfreq} Hz")
print("Stimulus frequencies (Hz):", class_names)
Channels: ['PO7', 'PO3', 'POz', 'PO4', 'PO8', 'O1', 'Oz', 'O2']; sampling frequency: 256.0 Hz
Stimulus frequencies (Hz): ['9.25', '9.75', '10.25', '10.75', '11.25', '11.75', '12.25', '12.75', '13.25', '13.75', '14.25', '14.75']
3. Make one four-second window per annotated trial#
Each annotated interval is 4.15 seconds. Keep its first four seconds and
discard the remainder. Explicit size and stride avoid overlapping windows
or extending the epoch beyond the recorded event duration.
At 256 Hz, four seconds contain 1,024 samples. The resulting array has
axes (540 trials, 8 EEG channels, 1,024 samples), with volt-valued data.
The metadata has one row per array row. target is a class index, not a
frequency in Hz; mapping is the explicit conversion between them.
The source contains 15 trials of each of the 12 frequencies per person.
A missing class is a data-contract failure, not a reason to relabel trials.
window_size = int(4 * sfreq)
windows = create_windows_from_events(
    dataset,
    mapping=mapping,
    trial_start_offset_samples=0,
    trial_stop_offset_samples=0,
    window_size_samples=window_size,
    window_stride_samples=window_size,
    on_last_window="drop",
    preload=True,
)
metadata = windows.get_metadata()
y = metadata["target"].to_numpy(dtype=int)
groups = metadata["subject"].astype(str).to_numpy()
X = np.stack([window[0] for window in windows])
assert X.shape == (len(metadata), len(channel_names), window_size)
assert set(groups) == set(subjects)
assert np.isfinite(X).all()
print(pd.crosstab(groups, y, rownames=["subject"], colnames=["class"]))
class    0   1   2   3   4   5   6   7   8   9   10  11
subject
1        15  15  15  15  15  15  15  15  15  15  15  15
2        15  15  15  15  15  15  15  15  15  15  15  15
3        15  15  15  15  15  15  15  15  15  15  15  15
4. Extract spectral features from each window#
SSVEP responses contain energy at the stimulus frequency. Use log spectral power around each stimulus frequency, retaining all eight posterior channels. This per-window transform learns nothing from other trials or subjects. The scaler below, in contrast, must be fitted only on training subjects. EEGDash’s shared spectral preprocessor computes a Welch PSD with one four-second Hann segment and 0.25 Hz bins. Each narrow band is centered on a documented stimulus frequency; these centers define the task, not trial-specific predictors. Retaining eight channels gives 12 × 8 = 96 features. The already processed SSVEP release does not need another EEGPrep cleaning pass or visual latency correction.
spectral_bands_power sums selected PSD bins. Multiplying by their 0.25 Hz spacing converts V²/Hz to approximate band power in V². The log compresses that scale; the StandardScaler still fits only on training participants.
bands = {
    f"hz_{name}": (float(name) - 0.125, float(name) + 0.125) for name in class_names
}
spectral = FeatureExtractor(
    {"power": partial(spectral_bands_power, bands=bands)},
    preprocessor=partial(
        spectral_preprocessor,
        fs=sfreq,
        nperseg=window_size,
        noverlap=0,
        f_min=8,
        f_max=16,
    ),
)
feature_table = extract_features(
    windows, {"spectral": spectral}, batch_size=64, n_jobs=1
).to_dataframe()
assert feature_table.shape == (len(y), len(class_names) * len(channel_names))
features = np.log(np.maximum(feature_table.to_numpy() * sfreq / window_size, 1e-30))
assert np.isfinite(features).all()
Extracting features:   0%|          | 0/3 [00:00<?, ?it/s]
Extracting features: 100%|██████████| 3/3 [00:00<00:00, 23.83it/s]
Extracting features: 100%|██████████| 3/3 [00:00<00:00, 23.78it/s]
5. Fit on two subjects and predict the third#
Each subject is tested once. Construct a fresh pipeline in each fold so
neither scaling nor classifier fitting sees the held-out participant.
Hyperparameters are fixed here; tuning would need grouped validation
inside the training fold. The uniform-chance balanced accuracy is 1/12,
provided all twelve classes occur in the test fold, which we check.
Each outer fold contains 360 training trials from two participants and
180 test trials from the third. A fresh pipeline prevents fitted state from
crossing folds. The prediction buffer is filled at the original row indices;
test_counts detects either an omitted test trial or a repeated prediction.
To tune regularization or the frequency band, split the two training subjects again for inner validation before fitting the chosen setting on both. With only two inner subjects, such tuning is unstable; adding participants is a more informative extension than a large parameter grid.
predictions = np.full(len(y), -1, dtype=int)
test_counts = np.zeros(len(y), dtype=int)
rows = []
for train, test in LeaveOneGroupOut().split(features, y, groups):
    assert set(groups[train]).isdisjoint(groups[test])
    assert set(y[train]) == set(y[test]) == set(mapping.values())
    model = make_pipeline(StandardScaler(), LogisticRegression(max_iter=1000))
    model.fit(features[train], y[train])
    predictions[test] = model.predict(features[test])
    test_counts[test] += 1
    rows.append(
        {
            "subject": groups[test][0],
            "balanced_accuracy": balanced_accuracy_score(y[test], predictions[test]),
            "n_test_trials": len(test),
        }
    )
assert len(rows) == len(subjects)
assert np.all(test_counts == 1), "Every trial must be evaluated exactly once"
results = pd.DataFrame(rows)
print(results.to_string(index=False))
scores = results["balanced_accuracy"]
print(f"Subject mean +/- SD: {scores.mean():.3f} +/- {scores.std(ddof=1):.3f}")
subject  balanced_accuracy  n_test_trials
      1           0.233333            180
      2           0.133333            180
      3           0.255556            180
Subject mean +/- SD: 0.207 +/- 0.065
6. Inspect measured results#
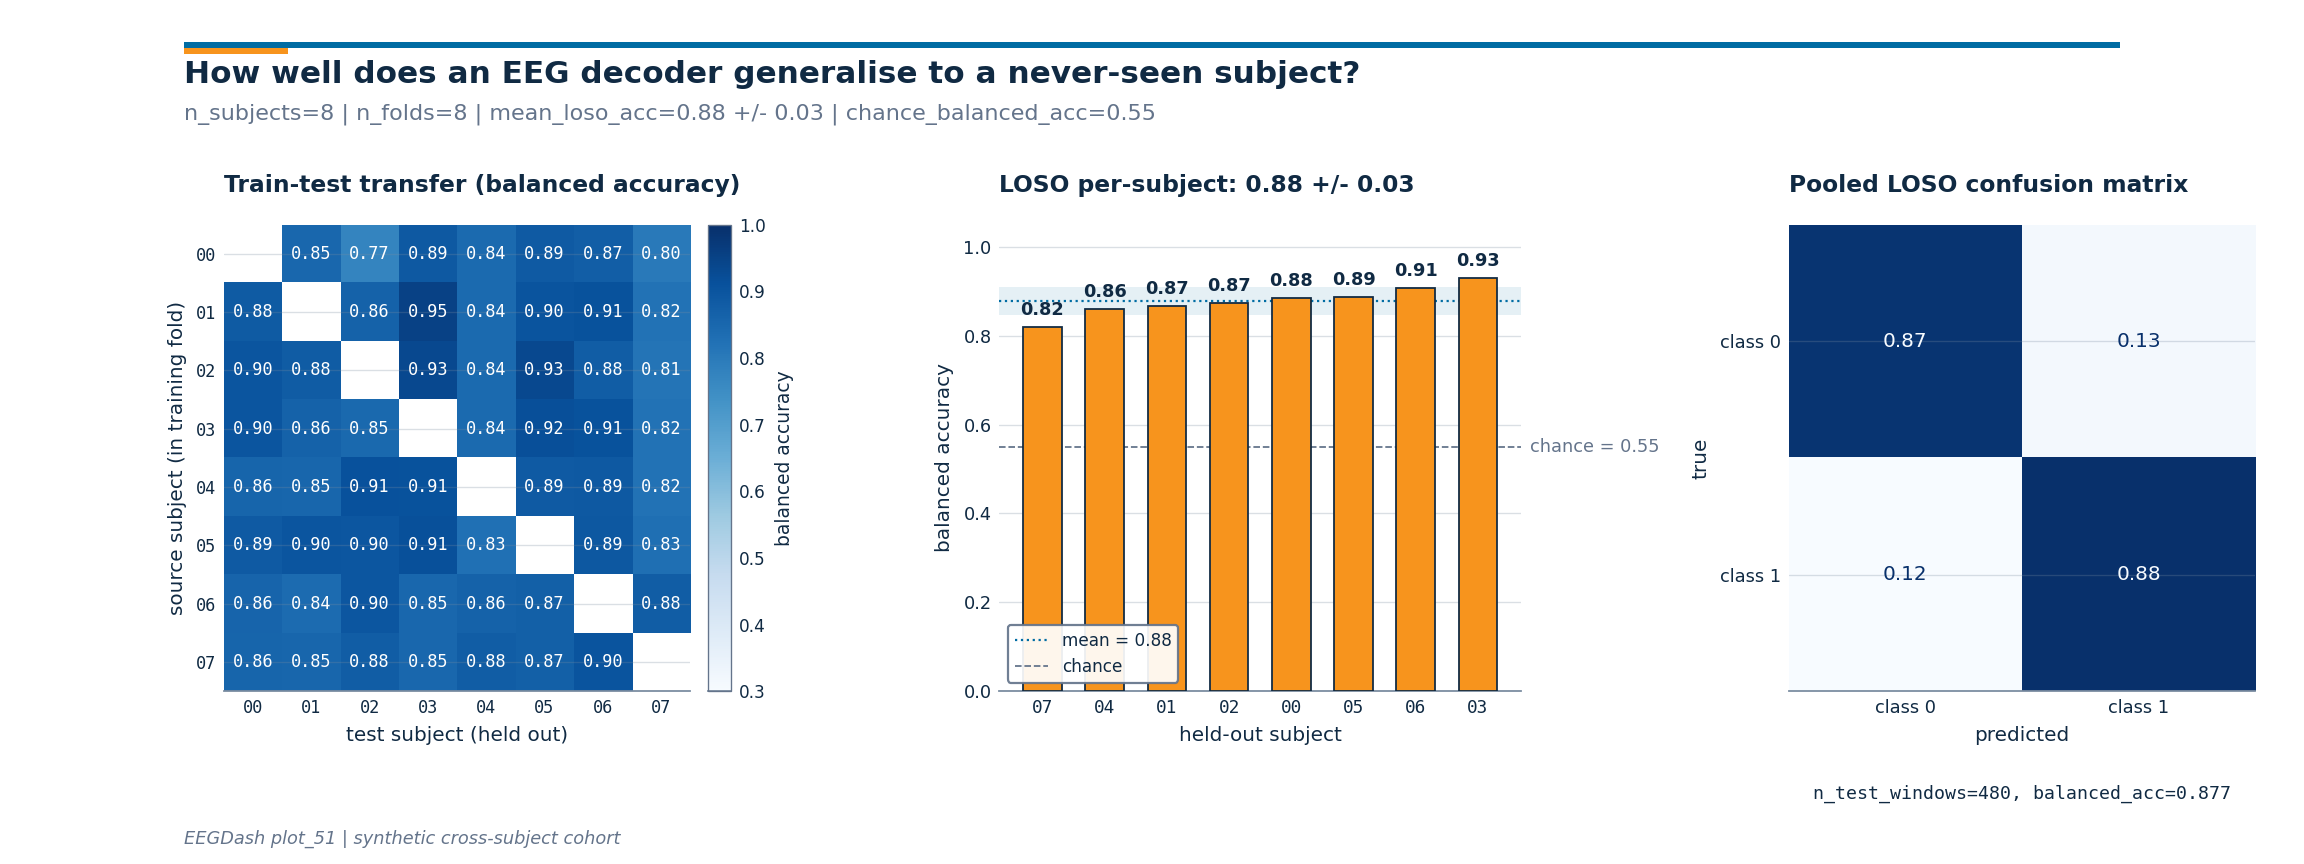
The bars show each held-out participant. The confusion matrix pools their predictions and normalizes each true class. No minimum accuracy is asserted: a weak decoder is a valid result, whereas a leaking split is an error.
fig, axes = plt.subplots(1, 2, figsize=(12, 5), layout="constrained")
axes[0].bar(results["subject"], scores)
axes[0].axhline(1 / len(mapping), color="black", linestyle="--", label="Chance (1/12)")
axes[0].set(xlabel="Held-out subject", ylabel="Balanced accuracy", ylim=(0, 1))
axes[0].legend()
ConfusionMatrixDisplay.from_predictions(
    y,
    predictions,
    labels=list(mapping.values()),
    display_labels=class_names,
    normalize="true",
    include_values=False,
    colorbar=False,
    xticks_rotation=90,
    ax=axes[1],
)
axes[1].set_title("Attended frequency (Hz)")
fig.suptitle("Nakanishi2015 / nm000118: three-subject LOSO")
plt.show()
[09/16/26 20:48:26] INFO     Using categorical units to plot a   category.py:224
                             list of strings that are all
                             parsable as floats or dates. If
                             these strings should be plotted as
                             numbers, cast to the appropriate
                             data type before plotting.
                    INFO     Using categorical units to plot a   category.py:224
                             list of strings that are all
                             parsable as floats or dates. If
                             these strings should be plotted as
                             numbers, cast to the appropriate
                             data type before plotting.
Three participants keep this example small enough for CI; they do not
establish a population-level benchmark. To extend the analysis, add real
subjects to the query and retain the same group-disjoint evaluation. For a
neural decoder, reuse these windows with EEGClassifier and reserve
validation subjects inside each training fold.
# Reading the two plots
# ---------------------
# The subject mean weights people equally. Its sample SD describes variation
# across these three people; it is not a confidence interval for a population.
# The normalized confusion matrix answers, for each true frequency, which
# frequencies receive its predictions. Its rows sum to one, so a darker cell
# means a larger fraction of that true class, not more trials in the cohort.
#
# Inspect confusions between nearby frequencies before proposing a finer
# spectral baseline. Freeze that proposal before evaluating additional held-out
# subjects. The already inspected participants are development data for that
# next experiment.
Total running time of the script: (0 minutes 1.380 seconds)
