


Note
Go to the end to download the full example code or to run this example in your browser via Binder.
Fit scikit-learn to the saved real feature table#
Run tutorial 40 first with the same EEGDASH_CACHE_DIR. This page reads
its real nm000118 table and schema, trains on subjects 1 and 2, then tests
subject 3. It does not download signals again or replace a missing table.
The three-participant source is about 21.1 MB; see tutorial 40 for data
provenance and extraction. This is a small workflow demonstration.
Before you start#
Install EEGDash’s dependencies and run plot_40_first_features.py first.
Use exactly the same EEGDASH_CACHE_DIR for both scripts; the default
.eegdash_cache is relative to the working directory. You need the CSV and
its adjacent JSON schema, but no live signal download for this page.
Tutorial 11 explains the participant split used below.
import json
import os
from pathlib import Path

import matplotlib.pyplot as plt
import numpy as np
import pandas as pd
from sklearn.linear_model import LogisticRegression
from sklearn.metrics import ConfusionMatrixDisplay, balanced_accuracy_score
from sklearn.pipeline import make_pipeline
from sklearn.preprocessing import StandardScaler
1. Load the exact table written by tutorial 40#
The schema’s feature list is an explicit allowlist. Selecting every numeric
column would leak the answer through target or frequency_hz and could
also include sample identifiers as predictors. The resulting matrix has one
row per recorded trial and 24 band/channel columns; the target and subject
vectors are kept separate.
The stored values are linear power summaries. Log10 compresses their range before learning, with a numerical floor for zero power. This transform acts on each value independently; unlike StandardScaler, it does not estimate statistics from held-out participants. The printed crosstab checks class coverage after the file handoff.
cache_dir = Path(os.environ.get("EEGDASH_CACHE_DIR", ".eegdash_cache"))
path = cache_dir / "plot_40_features.csv"
if not path.exists() or not path.with_suffix(".json").exists():
    raise FileNotFoundError(
        "Run plot_40_first_features.py with the same EEGDASH_CACHE_DIR first"
    )
table = pd.read_csv(path, dtype={"subject": str, "session": str, "run": str})
schema = json.loads(path.with_suffix(".json").read_text())
assert schema["dataset"] == "nm000118"
columns = schema["feature_columns"]
assert columns and set(columns).issubset(table.columns)
assert not table.duplicated(["subject", "session", "run", "i_start_in_trial"]).any()
X = np.log10(np.maximum(table[columns].to_numpy(), 1e-30))
y = table["target"].to_numpy(dtype=int)
groups = table["subject"].astype(str).to_numpy()
assert np.isfinite(X).all()
assert set(groups) == {"1", "2", "3"}
print(pd.crosstab(groups, y))
print("Feature matrix:", X.shape)
col_0  0   1   2   3   4   5   6   7   8   9   10  11
row_0
1      15  15  15  15  15  15  15  15  15  15  15  15
2      15  15  15  15  15  15  15  15  15  15  15  15
3      15  15  15  15  15  15  15  15  15  15  15  15
Feature matrix: (540, 24)
2. Fit the scaler and classifier on the training subjects only#
Subjects 1 and 2 supply every scaler statistic and classifier coefficient;
subject 3 supplies only final predictions. The pipeline binds those learned
operations so predict applies the training scale rather than fitting a
new scale to the test participant. The solver has up to 1,000 iterations;
if it warns about convergence, inspect training conditioning and optimize
within training data before treating the fitted coefficients as stable.
Balanced accuracy is the mean recall across the twelve frequency classes. A result near 1/12 can be consistent with the information discarded by broad bands: many distinct flicker frequencies fall in the same band. That is a limitation of this feature representation, not a reason to replace the measured score with a more attractive number.
train, test = groups != "3", groups == "3"
assert set(groups[train]).isdisjoint(groups[test])
assert set(y[train]) == set(y[test]) == set(schema["mapping"].values())
pipe = make_pipeline(StandardScaler(), LogisticRegression(max_iter=1000))
pipe.fit(X[train], y[train])
predictions = pipe.predict(X[test])
print("Subject 3 balanced accuracy:", balanced_accuracy_score(y[test], predictions))
Subject 3 balanced accuracy: 0.08333333333333333
3. Inspect actual predictions and fitted coefficients#
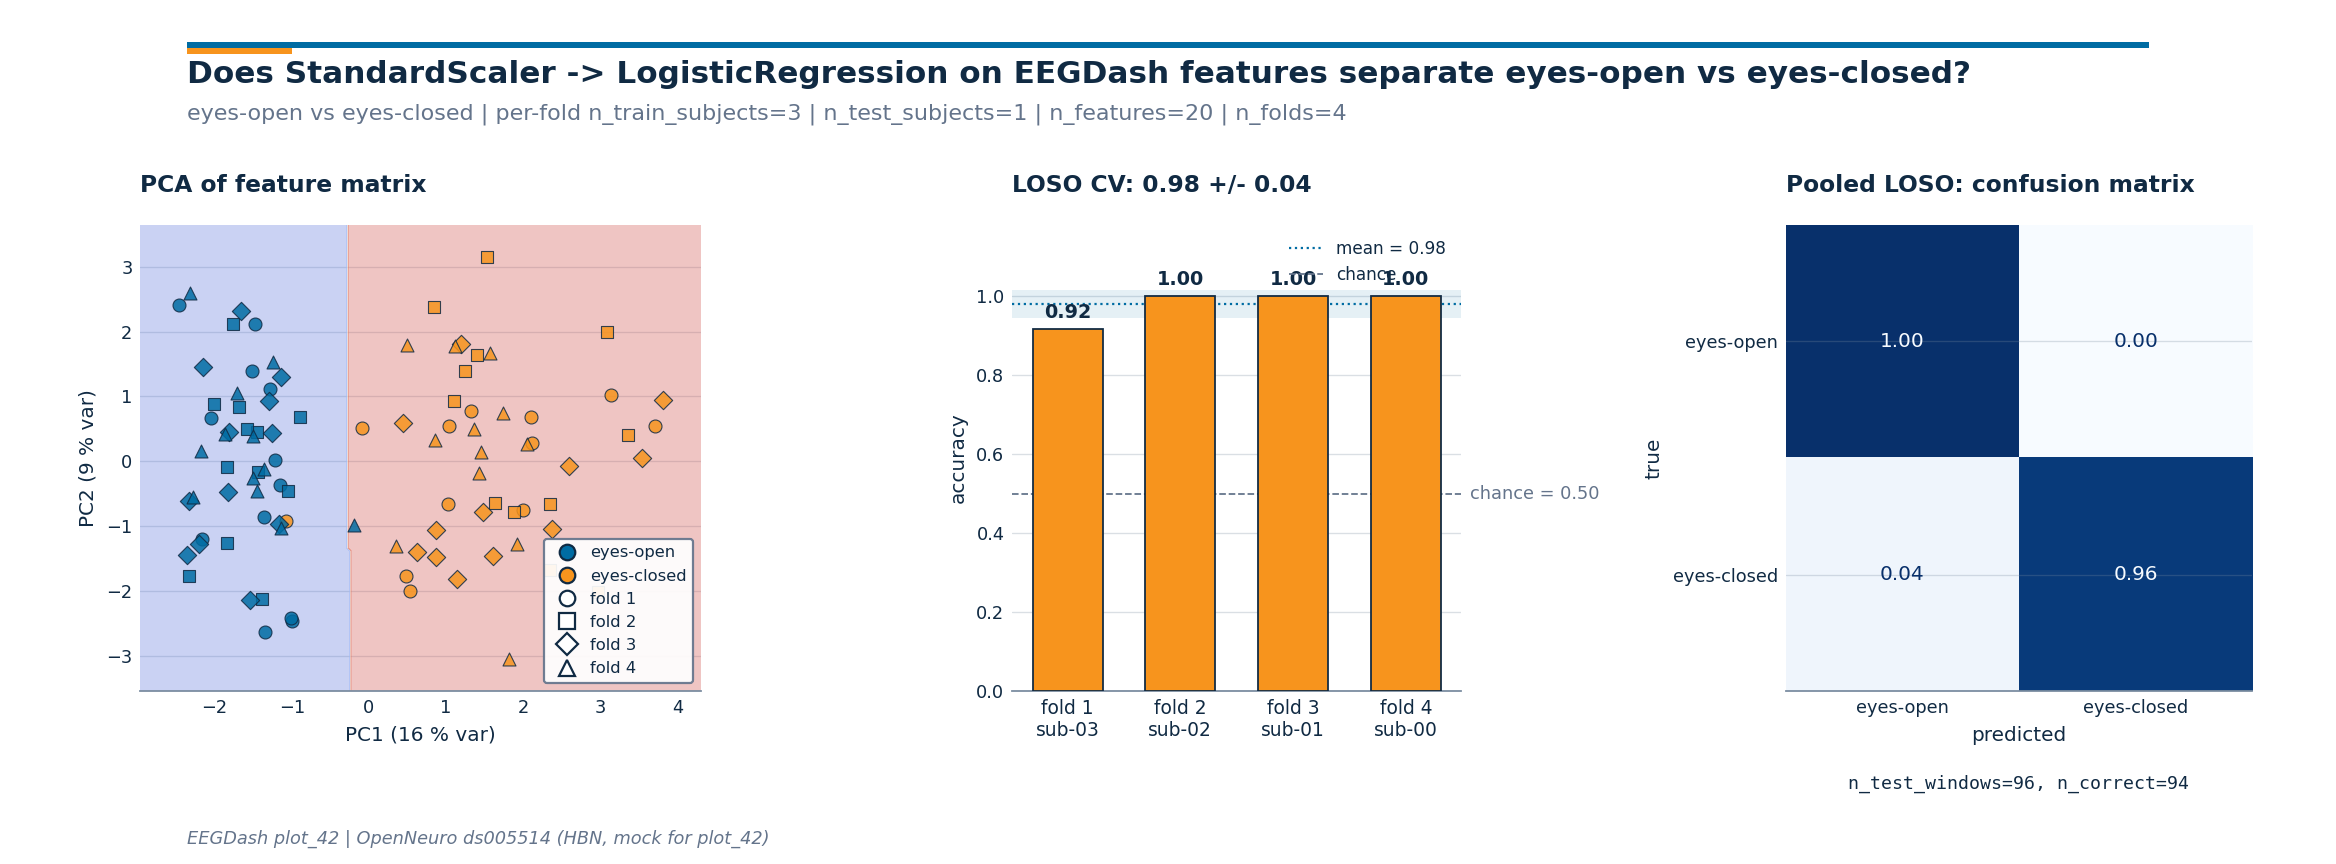
The confusion matrix is row-normalized, so each row describes the predicted class distribution for a single true class. Its integer labels are the frequency indices stored in the JSON mapping.
For each feature, the right plot averages the absolute fitted coefficient over all class decisions and displays the eight largest. Scaling makes magnitudes easier to compare, but correlated features can share or exchange weight. Taking absolute values also removes the direction and class-specific sign, so the plot is a model summary, not evidence that a band causes the stimulus response.
fig, axes = plt.subplots(1, 2, figsize=(12, 5), layout="constrained")
ConfusionMatrixDisplay.from_predictions(
    y[test],
    predictions,
    normalize="true",
    include_values=False,
    colorbar=False,
    ax=axes[0],
)
axes[0].set_title("Held-out subject 3 (frequency-class indices)")
weights = np.abs(pipe.named_steps["logisticregression"].coef_).mean(axis=0)
order = np.argsort(weights)[-8:]
axes[1].barh(np.asarray(columns)[order], weights[order])
axes[1].set(
    xlabel="Mean absolute standardized coefficient", title="Training-fit coefficients"
)
plt.show()
Choose the next feature experiment#
Tutorial 12 retains fine spectral bins instead of broad band sums. Compare that idea on a training validation split before opening a fresh test cohort. If you change the table in tutorial 40, regenerate its schema and rerun this page rather than manually guessing column order.
